BTCUSD Market Analysis – 22 July 2026
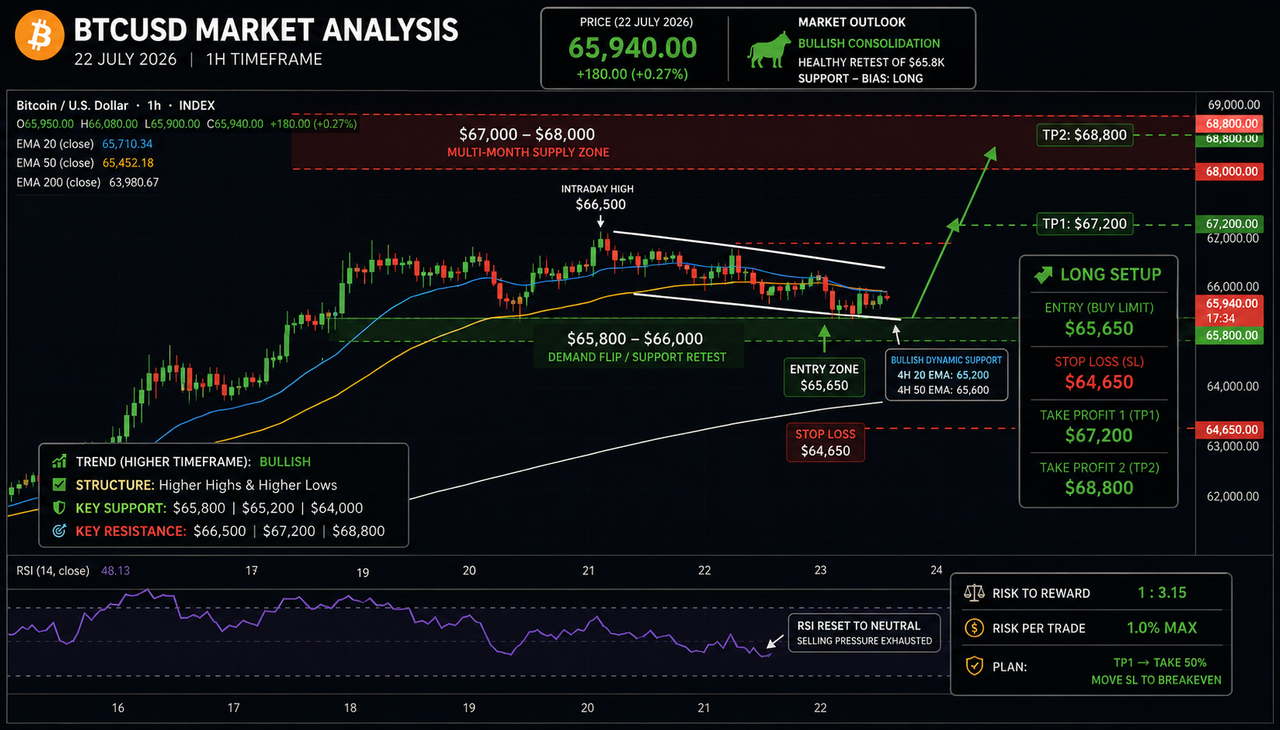
BTCUSD Market Analysis (22 July 2026) — Healthier Retest of $65.8K Support as Bulls Consolidate Below the $67K Multi-Month Supply Zone
Following the aggressive upside momentum triggered earlier in the week, BTCUSD reached an intraday high near the critical $66,500 — $67,000 horizontal barrier before entering a healthy, low-volatility pullback. As of July 22, 2026, Bitcoin is trading in a tight consolidation zone around $65,940 — $66,180. This price action represents a classic structural retest of the broken $65,800 demand level, allowing short-term indicators to reset while smart money builds liquidity for a sustained attempt at the $67,000 to $68,000 breakout threshold. Below is today’s complete multi-dimensional technical, fundamental, and execution strategy matrix.
1. Fundamental & Sentiment Analysis
Macro risk drivers and institutional product launches are shaping a resilient floor beneath the crypto asset market.
- Institutional Index Adoption: Major financial benchmark providers, including S&P Dow Jones Indices in collaboration with Pantera Capital, have launched structured digital asset benchmarks (S&P Pantera Digital Asset Index). This institutional expansion provides dedicated portfolio allocators with disciplined entry vehicles into top-tier digital assets.
- Macro & Flight-from-Fiat Dynamics: Despite persistent strength in the U.S. Dollar Index (DXY) and hawkish central bank recalibrations following resilient labor data, Bitcoin continues to trade in tandem with scarce real commodities. This reflects growing hedging activity against potential long-term fiat degradation amidst escalating Middle East geopolitical risks.
- On-Chain Reserve Stability: Over 80% of circulating Bitcoin remains in the hands of long-term holders, with illiquid supply metrics holding near record highs. Although minor short-term profit-taking occurred near the $66,500 local high, structural sell-side pressure remains capped.
- Sentiment Profile: Constructive Consolidation. Derivatives leverage has cooled significantly after localized long liquidations, leaving the current price action driven by spot market absorption around the key $65,800 floor.
2. Multi-Timeframe Technical Breakdown
High Timeframes (1D, 4H)
- Daily Timeframe (1D): The higher-timeframe structure remains intact. Having established a firm higher-low above $64,000 earlier this week, the daily candle is printing a shallow retracement body resting directly on top of the 20-day SMA. A decisive daily consolidation above $66,500 will pave the way for a test of the major $68,000 structural supply cluster.
- 4-Hour Timeframe (4H): The 4H chart shows a controlled pullback to the $65,800 retest level. The 20 and 50 Exponential Moving Averages (EMAs) maintain a bullish alignment between $65,200 and $65,600, offering strong dynamic demand on any deeper intraday wick.
Low Timeframes (1H, 15M, 5M)
- 1-Hour Timeframe (1H): Price action is forming a descending wedge/flag structure between $65,800 and $66,400. This technical pattern frequently resolves with a high-volume breakout in the direction of the underlying macro trend.
- 15-Minute & 5-Minute Timeframes (15M / 5M): Low-timeframe RSI has successfully reset from near-overbought conditions to neutral territory (~48), signaling that the intraday selling pressure has exhausted itself near the $65,800 support shelf.
3. Actionable Trade Setup & Execution Strategy
Because price is currently resting on a validated demand flip ($65,800 — $66,000), entering long positions on a structured pullback offers an exceptional risk-to-reward ratio. We set a Pending Buy Limit Order at the lower boundary of the 1-hour support block.
| Parameter | Execution Value | Technical Justification |
|---|---|---|
| Order Type | Buy Limit (Pending) | Positioned to catch an intraday liquidity dip into key 1H/4H support confluence. |
| Entry Zone | $65,650 | Confluence of the 1H demand flip, 4H 20 EMA, and local order block support. |
| Stop Loss (SL) | $64,650 | Placed below the 1H swing low and structural $64,800 invalidation zone. |
| Take Profit 1 (TP1) | $67,200 | Targeting the recent local high and upper range liquidity pool. |
| Take Profit 2 (TP2) | $68,800 | Targeting the major daily supply node and key 2026 breakout level. |
| Risk-to-Reward Ratio | 1:3.15 | Optimized asymmetrical setup aligned with high-timeframe trend continuation. |
4. Capital Allocation & Portfolio Defense
- Risk Allocation: Risk a maximum of 1.0% of total account capital on this setup. Given ongoing equity market earnings events and macroeconomic volatility, discipline is paramount.
- Profit Protection Rule: When price reaches **$67,200 (TP1)**, take 50% partial profits and trail the stop-loss parameter to entry (**Break-Even at $65,650**).
- Macro Execution Filter: Monitor U.S. market opening equity volume and big tech earnings reports. A strong bounce in risk assets will accelerate BTCUSD towards the TP2 target of $68,800.


Comments
Post a Comment