BTCUSD Market Analysis – 31 July 2026
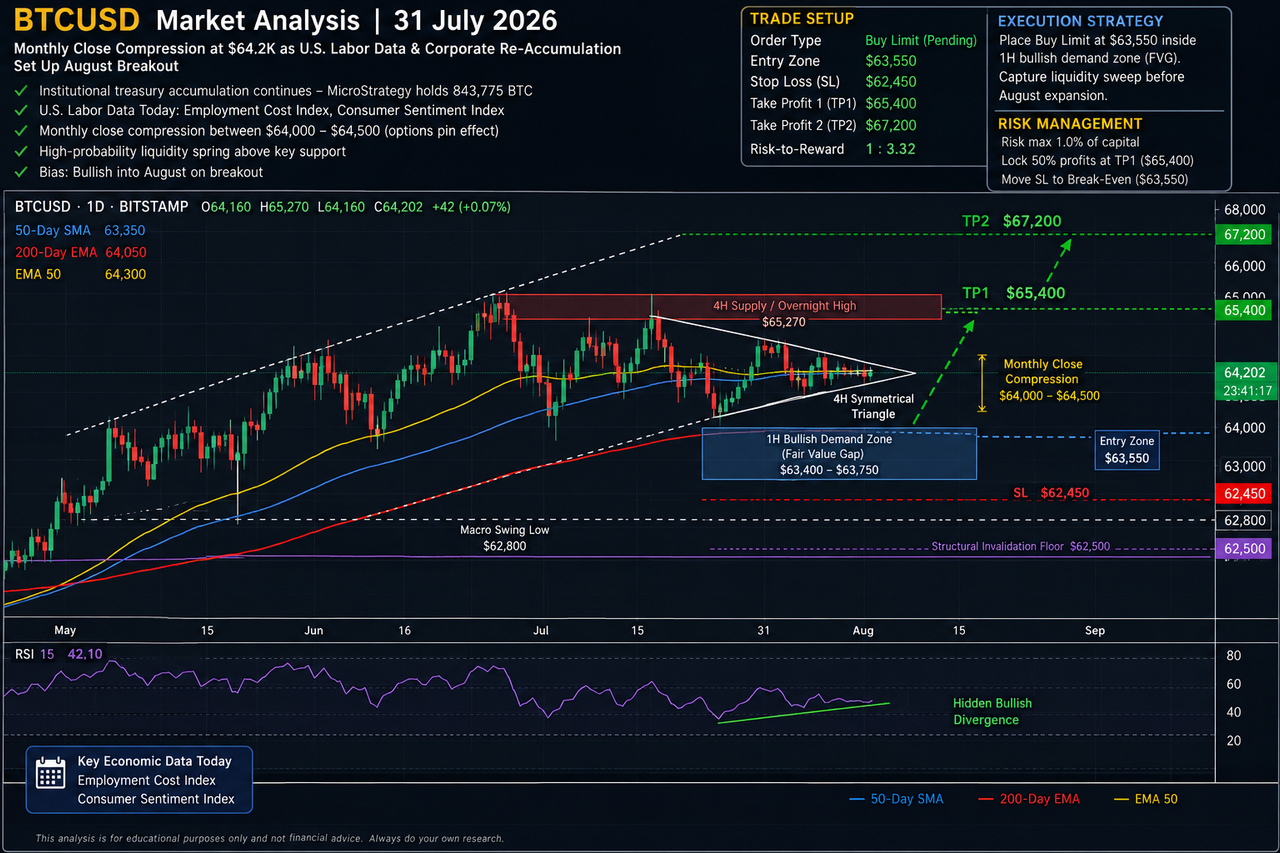
BTCUSD Market Analysis (31 July 2026) — Monthly Close Compression at $64.2K as U.S. Labor Data & Corporate Re-Accumulation Set Up August Breakout
As traders enter the final trading session of the month on Friday, July 31, 2026, BTCUSD is trading live at $64,202, maintaining tight consolidation following overnight fluctuations between $64,160 and $65,270. With the market absorbing the Federal Reserve's hawkish rate hold earlier in the week and institutional earnings reports confirming continued treasury accumulation, price action is coiling tightly ahead of today's U.S. macro economic releases (Employment Cost Index and Consumer Sentiment). As the monthly candle close approaches, Bitcoin is establishing a high-probability liquidity spring above major structural support. Below is today's detailed multi-timeframe fundamental, technical, and trade execution strategy matrix.
1. Fundamental & Sentiment Analysis
Corporate treasury accumulation, post-FOMC stabilization, and key monthly economic data define today's macro backdrop.
- Institutional Treasury Support: Q2 corporate earnings reports released over the last 24 hours confirm ongoing institutional spot backing. MicroStrategy (Strategy) reported its holdings reached 843,775 BTC, demonstrating strong fundamental demand that absorbs short-term speculative selling.
- U.S. Economic Data Docket (July 31): Markets are evaluating key labor cost and inflation proxy metrics today, including the U.S. Employment Cost Index and the University of Michigan Consumer Sentiment Index. Softer wage growth trends reinforce expectations that monetary tightening has reached its ceiling, offering a favorable tailwind for risk assets.
- Pre-Monthly Close Position Balancing: Traditional asset managers and derivatives desks are actively rebalancing options exposures ahead of the monthly close. This options pin effect is anchoring BTC within the $64,000–$64,500 corridor.
- Sentiment Profile: Neutral-Bullish / Monthly Coil. Market-wide sentiment remains disciplined following mid-week leverage resets. Derivatives funding rates are flat, indicating that organic spot buying is driving the current baseline rather than over-leveraged long positions.
2. Multi-Timeframe Technical Breakdown
High Timeframes (1D, 4H)
- Daily Timeframe (1D): The daily chart continues to defend its 50-day SMA ($63,350) as structural support. Price is printing a series of higher low wicks on the daily timeframe, holding firmly within its macro ascending channel. A monthly close above $64,000 secures a constructive foundation for an August expansion toward $67,500+.
- 4-Hour Timeframe (4H): The 4H chart exhibits a symmetrical triangle consolidation pattern. Dynamic support rests at the 200 EMA ($64,050) and 50 EMA ($64,300), with Bollinger Bands contracting to their tightest bandwidth of the week, signaling an imminent directional breakout.
Low Timeframes (1H, 15M, 5M)
- 1-Hour Timeframe (1H): Overnight order flow pushed price to an intraday high of $65,270 before a low-volume retracement back to $64,200. This move leaves a pristine, unmitigated bullish order block and Fair Value Gap (FVG) between $63,400 and $63,750.
- 15-Minute & 5-Minute Timeframes (15M / 5M): Micro-price action shows a slowing bearish momentum curve as price approaches $64,150. The 15M RSI sits near 42, printing hidden bullish divergence against the overnight low.
3. Actionable Trade Setup & Execution Strategy
With price compressing near $64,200 into the monthly close, initiating a market order inside middle-range chop carries unnecessary risk. The optimal approach is a Pending Buy Limit Order placed inside the 1H bullish demand block to catch a final NY session liquidity sweep before the weekend expansion.
| Parameter | Execution Value | Technical Justification |
|---|---|---|
| Order Type | Buy Limit (Pending) | Designed to capture an intraday liquidity retest of the 1H demand zone before the monthly close. |
| Entry Zone | $63,550 | Confluence of the 1H Fair Value Gap, 50-day SMA baseline, and 4H triangle support floor. |
| Stop Loss (SL) | $62,450 | Placed safely below the key macro swing low ($62,800) and $62,500 structural invalidation floor. |
| Take Profit 1 (TP1) | $65,400 | Targeting the overnight liquidity sweep high and 4H supply boundary. |
| Take Profit 2 (TP2) | $67,200 | Targeting top-of-range daily liquidity heading into early August positioning. |
| Risk-to-Reward Ratio | 1:3.32 | Highly efficient risk distribution optimized for monthly close re-accumulation entries. |
4. Capital Allocation & Portfolio Defense
- Position Risk Management: Maintain a strict risk ceiling of 1.0% of account capital. Pre-weekend monthly closing rebalancing can induce temporary spread widening on lower timeframes.
- Profit Protection Rule: When price expands to $65,400 (TP1), lock in 50% of trade profits immediately and adjust your stop loss to **Break-Even ($63,550)**.
- Weekend Hold Protocol: If the limit order triggers and remains active into Friday's NY close, ensure position margins are balanced to account for low-liquidity weekend gaps prior to Monday's weekly open.


Comments
Post a Comment