BTCUSD Market Analysis – 2 August 2026
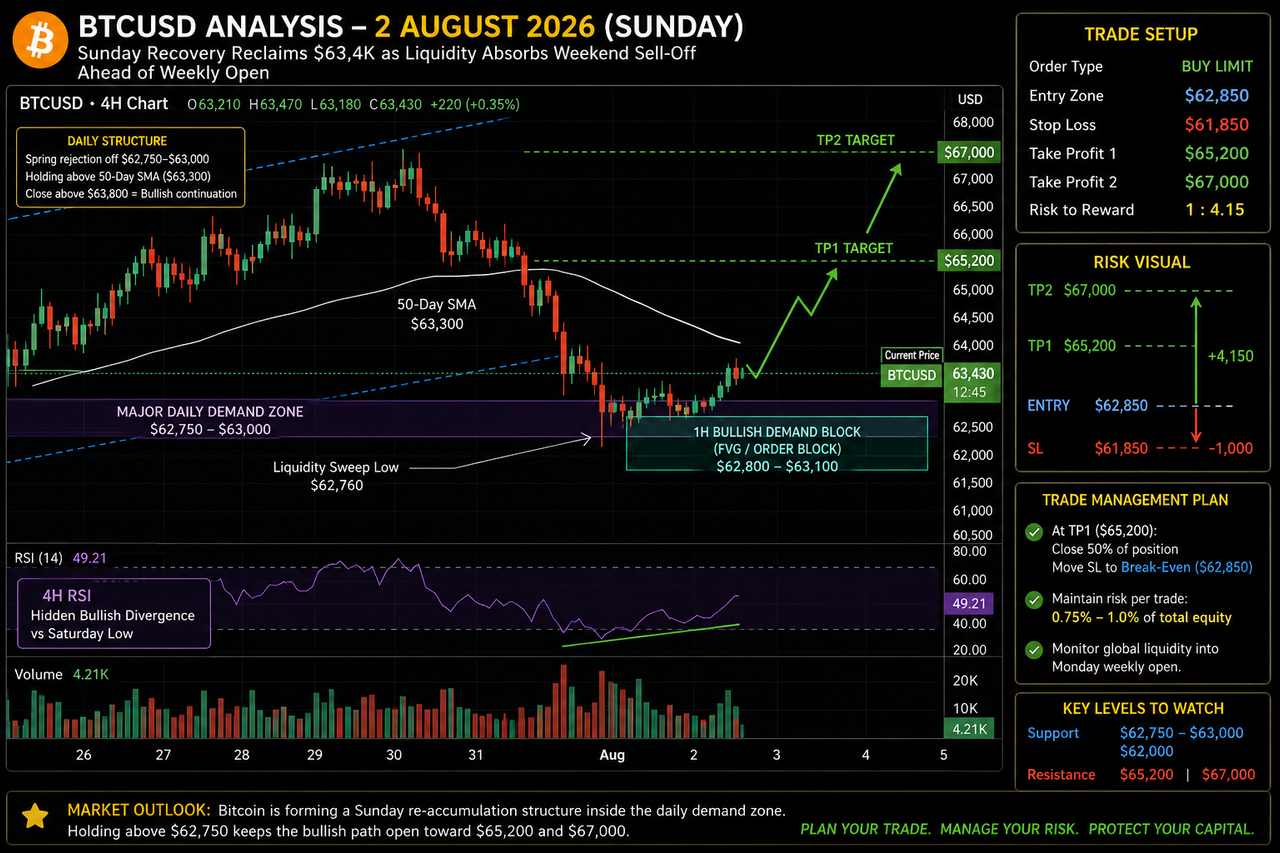
BTCUSD Market Analysis (2 August 2026) — Sunday Recovery Reclaims $63.4K as Liquidity Absorbs Weekend Sell-Off Ahead of Weekly Open
On Sunday, August 2, 2026, BTCUSD is demonstrating strong resilience, rebounding back to trade live at $63,430 after briefly probing a two-week liquidity low near $62,760. Fading fears over recent corporate tech earnings and the Federal Reserve’s interest rate pause have allowed spot buyers to step in and absorb over-extended leverage liquidations. As traders prepare for the upcoming weekly candle open and fresh institutional spot capital flows, Bitcoin is forming a classic Sunday re-accumulation structure within its higher-timeframe demand corridor. Below is your complete multi-timeframe fundamental, technical, and execution strategy matrix for today's session.
1. Fundamental & Sentiment Analysis
Weekend position clearing, absorption of recent ETF outflows, and stabilizing global market liquidity define today's macro environment.
- Post-FOMC & Weekly Reset: Following the Federal Reserve’s interest rate pause at 3.50%–3.75% earlier in the week, risk assets have digested the central bank's hawkish tone. With macro data showing signs of cooling wage pressures, long-term liquidity expectations remain supportive for digital assets.
- Spot ETF Outflow Stabilization: After a four-day series of spot Bitcoin ETF outflows, institutional selling pressure has decelerated into the weekend. Crypto-native spot buyers are stepping into passive order books below $63,000 to defend key moving average baselines.
- Derivatives Leverage Flush: The $510M+ liquidation cascade seen earlier in the week cleansed speculative long positions. Current funding rates across major derivatives venues have reset back to neutral baselines (~0.004%), signaling an organic, spot-led recovery phase.
- Sentiment Profile: Fear / Re-Accumulation Zone. The Crypto Fear & Greed Index rests near 35 (Fear). Historically, buying into extreme weekend fear when major daily demand blocks hold has offered optimal risk-reward entry opportunities for swing positions.
2. Multi-Timeframe Technical Breakdown
High Timeframes (1D, 4H)
- Daily Timeframe (1D): The daily tape exhibits a clean spring rejection off the $62,750–$63,000 support floor. Daily price action remains anchored near its 50-day SMA ($63,300), preserving the multi-month macro ascending channel. A daily close above $63,800 sets up a bullish continuation toward $66,000+.
- 4-Hour Timeframe (4H): The 4H chart shows price forming a bullish morning star pattern off $62,760. The 4H Relative Strength Index (RSI) has turned upward from 38 to 49, printing hidden bullish divergence against the Saturday low.
Low Timeframes (1H, 15M, 5M)
- 1-Hour Timeframe (1H): Order flow has shifted back to a bullish market structure with consecutive higher highs on the 1H timeframe. An unmitigated Fair Value Gap (FVG) and institutional order block exist between $62,800 and $63,100.
- 15-Minute & 5-Minute Timeframes (15M / 5M): Micro-price action shows strong buyer absorption above $63,300. The 15M RSI sits at 54, reflecting steady momentum without overbought readings into the Sunday NY afternoon session.
3. Actionable Trade Setup & Execution Strategy
Entering via market orders at $63,430 into thin weekend liquidity exposes trades to slippage. The optimal approach is a Pending Buy Limit Order positioned at the retest of the 1H bullish demand block to front-run the Monday weekly open expansion.
| Parameter | Execution Value | Technical Justification |
|---|---|---|
| Order Type | Buy Limit (Pending) | Designed to catch a discount liquidity retest prior to Monday's institutional market open. |
| Entry Zone | $62,850 | Confluence of the 1H Bullish FVG, 50-day SMA baseline, and Sunday liquidity sweep floor. |
| Stop Loss (SL) | $61,850 | Placed strictly below the major $62,000 structural pivot and macro invalidation level ($1,000 risk). |
| Take Profit 1 (TP1) | $65,200 | Targeting immediate overhead 4H resistance and weekly broken supply ($2,350 gain). |
| Take Profit 2 (TP2) | $67,000 | Targeting top-of-range daily liquidity and recent local highs ($4,150 gain). |
| Risk-to-Reward Ratio | 1:4.15 | Highly asymmetrical risk profile optimized for weekly open re-accumulation entries. |
4. Capital Allocation & Portfolio Defense
- Position Risk Management: Maintain a strict trade risk allocation of 0.75% — 1.0% of total portfolio equity.
- Profit Securing Protocol: Upon reaching $65,200 (TP1), close 50% of trade volume immediately and shift the stop loss to **Break-Even ($62,850)** to guarantee a risk-free position into early August trading.
- Weekly Open Adjustment: If the order remains active into Sunday night's Asian market open, monitor global liquidity spreads as traditional equity futures open.


Comments
Post a Comment